










Self-service reporting software for faster business insights
Bold Reports is self-service reporting software that gives business users the tools to build ad hoc reports with a drag-and-drop report designer, without waiting on IT. Connect to SQL, cloud, and API data sources, and embed reporting directly into your own application.
No credit card required. Cloud, on-premises, or Docker deployment. RDL report compatible.
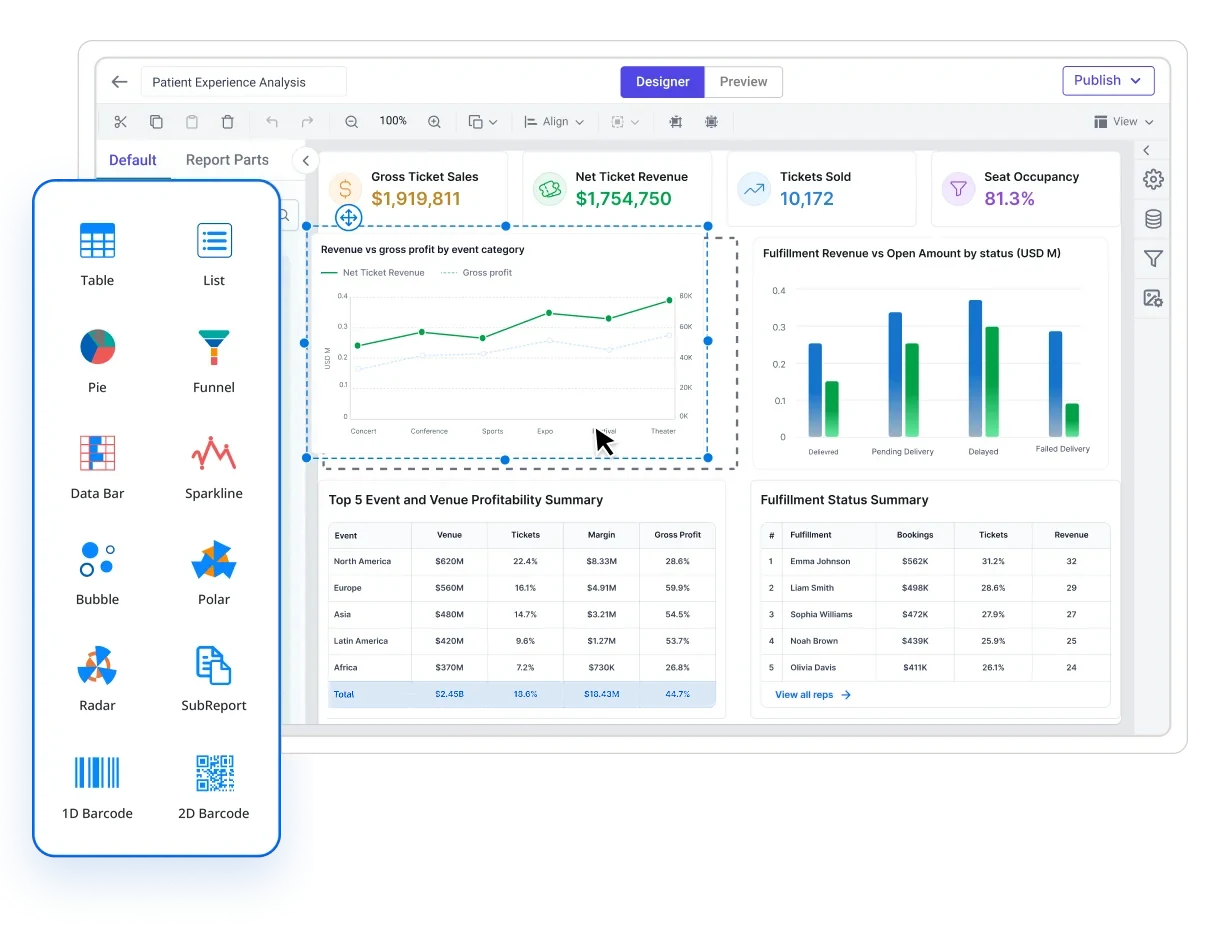
No-code designer
Drag-and-drop, browser based.
Share with control
Publish to the people who should see it, and only them.
Zero IT tickets
Business users self-serve their own reports.
One shared library
Every report searchable and reusable.
Self-service reporting means the user builds the report
Self-service reporting is an approach where business users create, filter, and share their own reports from data that IT has already prepared and secured, without writing queries or raising a request.
It is also called self-service BI or ad hoc reporting. The shift is not the tool, it is the division of labour: IT owns the connections, datasets, and permissions, and the person with the question owns the report.
Self-service does not mean ungoverned. In Bold Reports, every report a user builds runs inside the same permission model IT configures.
Users start from governed datasets
Joins, filters, and business field names are defined once, so nobody rebuilds query logic to answer a question.
No query language required
Fields are dragged onto a canvas and previewed live, which is what makes the "self" in self-service realistic.
Access is decided centrally
Role-based access and row-level security travel with the report, so opening report building does not mean opening the data.
One report, many answers
Parameters, templates, and scheduling mean a report is built once and then keeps answering questions on its own.
Every day without self-service reporting costs you
Report requests do not stop coming. Without a self-service option, they all land in the same queue, and the workaround users reach for creates its own problems.
Without self-service reporting
- Report requests pile up behind other IT work in the same queue.
- Every small change, a new filter, a new column, means a new ticket and another wait.
- Users export to spreadsheets to get an answer today, and the spreadsheet becomes the record.
- Different teams write their own queries, so the same metric comes out differently in two reports.
- Once data is exported, row-level access controls no longer apply to it.
- A report built for one request gets rebuilt from scratch for the next one.
With self-service reporting in Bold Reports
- Users build and update their own reports without waiting on IT.
- Parameters and filters answer new questions without a new ticket.
- Reports run on live, connected data instead of exported files.
- Shared datasets keep field names and definitions consistent across every report.
- Role-based access and row-level security travel with the report, exported or not.
- Templates and reusable datasets mean nothing starts from a blank page.
How self-service reporting works in Bold Reports
IT connects the data and publishes a shared dataset once. From there, users build, filter, and schedule their own reports without waiting on a developer for each request.
Connect your data
IT connects SQL Server, PostgreSQL, MySQL, Oracle, REST APIs, Excel files, and cloud sources through Bold Data Hub and data connectors. Credentials stay with the administrator.
Prepare shared datasets
Join tables, rename fields to business language, add filters, and publish the dataset so every report starts from the same definitions.
Let users build
Users start from a template or a blank canvas, drag fields into tables, charts, and KPI tiles, add parameters, and preview the report as it will be delivered.
Share, schedule, embed
Publish to a folder with role-based access, email it on a schedule, export to PDF, Excel, Word, or CSV, or embed it in your own application.
A security layer at every point in the request path
Every report request passes through the same stack, whether it's a dashboard view, an export, or an admin action.
- Authentication: local credentials, LDAP, Azure ADFS, or OpenID Connect/OAuth 2.0.
- Authorization: read, write, create, and delete permissions per report, source, and dataset.
- Data security: per-site isolation, so one site's users and data are never visible to another.
- Application security: unique per-installation keys encrypt stored passwords and connection details.
- Network security: TLS 1.2+ recommended end to end, from browser to server to database.
Client browser or app
TLS 1.2+ / HTTPS
Bold Reports server
Authentication (LDAP, Azure ADFS, OAuth 2.0)
Authorization (role & site permissions)
Per-site data isolation
Encrypted database & stored credentials
What your team gets
Everything below is a capability business users get without asking IT to build or approve it first.
No-code report designer
Build reports in the browser by dragging fields onto the canvas
- WYSIWYG canvas with live preview
- Tables, matrices, lists, and subreports
- Grid-based placement for precise layout
Reusable datasets
Publish a dataset once and let every report work from the same joined, business-named data.
- Central joins, filters, and field names
- One change updates every report using it
- No query writing for report builders
Live data connections
Report on connected sources instead of exported spreadsheets.
- SQL Server, PostgreSQL, MySQL, Oracle
- REST APIs, Excel, CSV, and cloud sources
- Data preparation through Bold Data Hub
Parameters and ad hoc filtering
Let readers change the question without editing the report.
- Date range, region, product, and cascading parameters
- Sorting, grouping, and drill-down
- One report serves many audiences
20+ chart types and visualizations
Choose the visual that fits the question, on a layout you control.
- Charts, gauges, maps, and indicators
- Conditional formatting for exceptions
- Repeating headers, footers, and page numbers
Global and multilingual reporting
Support teams across regions from one deployment.
- Localized report viewer and designer UI
- Regional date, number, and currency formats
- Consistent reporting across offices
Scheduled delivery and exports
Let a finished report keep delivering itself.
- Recurring email delivery with attachments
- PDF, Excel, Word, PowerPoint, and image export
- Print-ready paginated output
Templates and version history
Start from a working layout and keep a trail of changes.
- Ready-to-use report templates
- Save your own layouts for reuse
- Review earlier versions or roll back
Drill-down and drill-through
Explore deeper without building a new report.
- Drill down from region to district to branch
- Drill through from a summary to a detail report
- Bookmarks and toggled show/hide sections
Centralized report portal
Every published report lives in one searchable place.
- Categories, folders, and tag-based search
- Favorites and thumbnail previews
- Mobile-responsive, no install required
Personalized report output
One report definition, a different output for each recipient.
- Reads each row of a dataset as a recipient
- Fills in that row's own filters and values
- No separate report definition per audience
Real-time collaboration
Work through a report together instead of over email.
- Comment and leave notes on a report
- Discuss changes inside the platform
- Keeps feedback attached to the report itself
The reports business users build and run themselves
Real report types teams build without IT, on live data, set to run on their own schedule.
Finance and accounting
Finance users build these against live ERP data, set them to run on the first of each month, and deliver them automatically to leadership without manual assembly.
Sales and revenue
Sales operations builds parameterized templates filtered by representative, region, or product at runtime, so one report serves the whole team.
Operations and inventory
Operations managers run these on demand or receive them automatically at the start of each day, on live connections rather than a stale export.
HR and workforce reporting
HR teams build and manage these reports without IT involvement, with row-level security ensuring managers see only their own teams.
Executive and board reporting
Delivered automatically to leadership inboxes on schedule, so decision-makers always have current numbers without asking anyone for them.
Self-service reporting with IT in control
The reason most organizations do not have self-service reporting is not the technology. It is the concern that opening up report creation leads to inconsistent numbers, unauthorized data access, and reports no one maintains. Bold Reports is built to address that directly.
Role-based access control
Set granular permissions on every report, folder, category, and data source. Permissions are assigned to users or groups and control who can view, create, edit, publish, schedule, or only run reports. Groups mirror your organizational structure, so adding a user to the right group immediately grants the right access.
Row-level security
The same report shows each user only the rows of data they are authorized to view. A regional manager sees their region, a country manager sees all regions. Configured once per report or dataset and applied automatically per user at runtime, without building a separate report for each audience.
User and group management
Import users from your directory via LDAP or provision them through the Bold Reports REST API. Group-level permissions cascade to every member, so moving a person to the right group instantly updates their access. Multi-site mode gives each department or client an isolated environment within one deployment.
Single sign-on integration
Sign in through OAuth 2.0, Azure Active Directory, OpenID Connect, or a custom provider, with existing organizational credentials and no separate Bold Reports password. MFA requirements from your identity provider apply automatically.
Audit logs and compliance
Report runs, data access, exports, schedule executions, logins, permission changes, and admin actions are all logged with timestamps, user identity, and IP address. Logs are searchable and exportable for compliance reporting. Connections are read-only by default.
Report approval workflows
Business users can build and modify reports but submit changes for review before they publish to other users. Administrators or designated reviewers approve or reject submissions, keeping the published library governed without IT building every report from scratch.
Deploy it where your data already lives - Run it self-hosted on Windows, Linux, Docker, or Kubernetes, on Azure App Service, or on the Bold Reports cloud edition. Every deployment option includes encryption in transit and at rest, full access logging, and an air-gapped, on-premises path for teams that need full data residency.
Traditional reporting vs self-service reporting
Same data, different operating model. The difference shows up in who does the work and how long a change takes.
| Comparison | IT-led traditional reporting | Self-service reporting with Bold Reports |
|---|---|---|
| Who builds the report | A developer or report writer, from a written request | The business user who needs it, from a published dataset |
| Skills required | SQL, report definition languages, sometimes deployment access | Drag and drop in the browser, no query writing |
| Turnaround for a new report | Queued behind other work in the reporting backlog | Built in the same session the question comes up |
| Cost of a small change | A new ticket, a new cycle, a new deployment | Edit the report or change a parameter value |
| Data preparation | Repeated per report, with query logic copied between reports | Done once in a shared dataset that every report reuses |
| Consistency of numbers | Depends on which query a given report happens to use | Shared datasets define joins, filters, and field names centrally |
| Governance and access | Enforced report by report, and bypassed by exported files | Role-based access and row-level security applied centrally |
| Ad hoc questions | Answered by exporting to a spreadsheet outside the platform | Answered with parameters and filters inside the report |
| Delivery | Manual runs, then attached to an email thread | Scheduled email delivery, exports to PDF, Excel, Word, CSV |
| Where IT spends its time | Writing and re-writing individual reports | Owning sources, datasets, permissions, and deployment |
-
* Bold Reports supports both models in one platform, so IT-authored paginated reports and user-built reports live side by side.
Give your own users self-service reporting
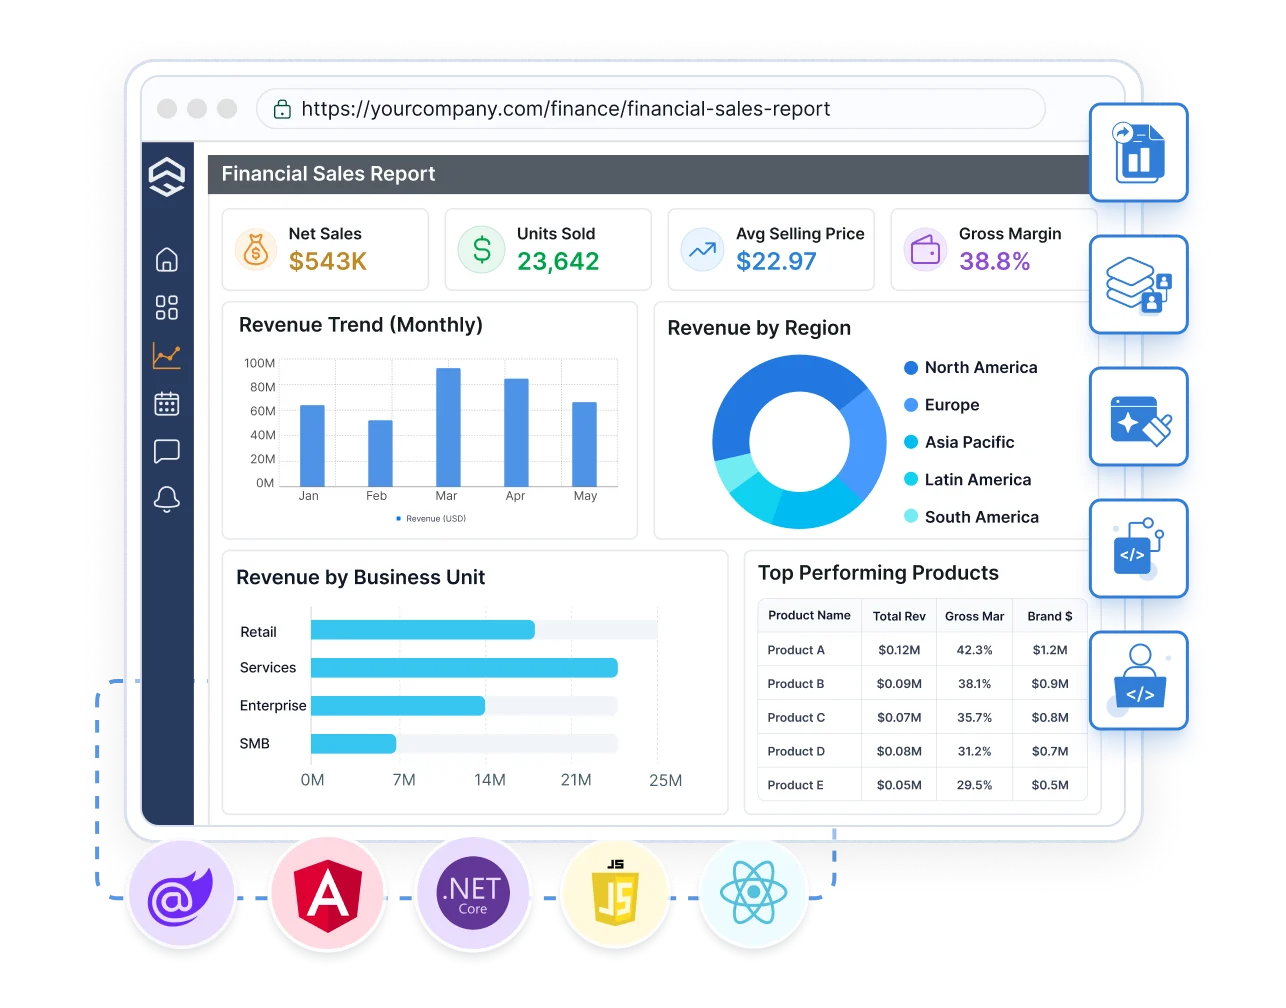
If you build software, self-service reporting can be a feature of your product rather than a tool beside it. Embed the report designer and viewer, match your branding, and isolate each customer's data.
- Embed the designer and viewer in modern web frameworks.
- White-label the interface with your logo, colors, and themes.
- Keep tenants isolated with multi-tenant support and row-level security.
Here's why our customers love us
See how Bold Reports is making an impact in businesses with powerful reporting, as shared by our satisfied customers.
Bold Reports is a user-friendly and powerful reporting tool. The desktop designer and writer for .NET Core make report creation easy, and connecting to databases is seamless. It’s a great solution for generating offers, invoices, and reports in our CRM app.
Muhammed Y
Co-Founder & Full-Stack Developer

We switched from SSRS with little effort. It works great in our WPF and Blazor applications, supports our old reports, and lets developers create new ones easily. The pricing is fair for ISVs, and the support team is fast and helpful. Onboarding was smooth and responsive.
Aaron S
CEO
Bold Reports was easy to integrate and works smoothly. It creates clean, professional-looking reports, and the documentation is clear with plenty of helpful examples. I had no issues during setup and it was a great experience overall.
Domenico D
Funzionario

Bold Reports is easy to use, enabling both teams and business users to modify reports confidently. Setup is quick and smooth. It integrates well with SQL Server, Microsoft Fabric, and other tools, reduces infrastructure complexity, and works reliably for recurring reports.
Brad M
Chief Information Officer


Bold Reports is a user-friendly and powerful reporting tool. The desktop designer and writer for .NET Core make report creation easy, and connecting to databases is seamless. It’s a great solution for generating offers, invoices, and reports in our CRM app.
Muhammed Y
Co-Founder & Full-Stack Developer
We switched from SSRS with little effort. It works great in our WPF and Blazor applications, supports our old reports, and lets developers create new ones easily. The pricing is fair for ISVs, and the support team is fast and helpful. Onboarding was smooth and responsive.
Aaron S
CEO
Bold Reports was easy to integrate and works smoothly. It creates clean, professional-looking reports, and the documentation is clear with plenty of helpful examples. I had no issues during setup and it was a great experience overall.
Domenico D
Funzionario
Bold Reports is easy to use, enabling both teams and business users to modify reports confidently. Setup is quick and smooth. It integrates well with SQL Server, Microsoft Fabric, and other tools, reduces infrastructure complexity, and works reliably for recurring reports.
Brad M
Chief Information Officer

Recognition
Support and resources
Documentation
Setup, dataset configuration, permissions, and API reference for teams rolling out self-service reporting.
Tutorials and webinars
Watch walkthroughs and join live sessions to see how reports and datasets are built end to end.
Knowledge base
Answers to specific questions and configuration recipes, organized by topic.
Technical support
Ask our team a question during evaluation or rollout and get help from people who know the product.
Frequently asked questions
What users need to know before building a report, and what IT needs to know before opening access to build one.
It is reporting where the person who needs the report builds it, using prepared data and a visual designer, instead of requesting it from a developer. IT prepares and secures the data once, and users create, filter, and share reports from it.
No. Reports are built by dragging fields from a published dataset onto the canvas and applying filters, groups, and sorting visually. Developers can still work with APIs when they want to.
Yes. Users can open a ready-to-use template, point it at a dataset, adjust fields, and publish. Teams can also save their own layouts as templates for reuse.
Yes. Reports can run on a schedule and be delivered by email, with export to PDF, Excel, Word, and CSV.
Yes. The report designer and viewer can be embedded in applications built with Angular, React, Blazor, JavaScript, and ASP.NET Core, with white-labeling and multi-tenant isolation.
Dashboards are built for monitoring a fixed set of metrics. Self-service reporting also covers detailed, paginated, print-ready output such as statements, invoices, and audit records, where layout and pagination matter.
In traditional reporting, a developer writes the query and the layout for each request, so every change starts a new cycle. In self-service reporting, data preparation happens once in a shared dataset, and users build and modify reports from it themselves. Bold Reports supports both in one platform.
Connection credentials stay with administrators. Users build only from datasets you publish, and role-based access plus row-level security control who can view or edit a report and which rows they see. Single sign-on and directory integration are supported.
SQL Server, PostgreSQL, MySQL, Oracle, REST APIs, Excel files, and cloud sources through Bold Data Hub and the data connector library.
Yes. Parameters let a reader change values such as date range, region, or product and rerun the report, so one report serves many audiences.
Yes. Bold Reports runs on Windows, Linux, Docker, Kubernetes, and Azure App Service, or you can use the cloud edition.
Let your team build their own reports
Start with your own data and see how far a business user can get without writing a query.
No credit card required.